The 25x rule says a $60,000-a-year retiree needs $1.5 million. A common refinement, subtract Social Security first and multiply what is left, says $750,000 is enough. We ran both targets through 5,000 Monte Carlo simulations in our calculator. The $1.5 million plan succeeded 97% of the time, and its median run ended at age 95 with more than twice what it started with. The $750,000 plan failed 57% of the time. The number that actually holds up for a single retiree sits between the two formulas, near $1.2 million. The math is below, along with where each shortcut breaks.
The quick answer: the 25x rule
The fastest way to estimate your number is to multiply your expected annual retirement spending by 25.
Quick math. Your number ≈ annual spending × 25. If you expect to spend $60,000 a year, that's $60,000 × 25 = $1.5 million.
The 25 comes from the other side of the 4% rule, credited to financial planner William Bengen's 1994 research. If you can safely withdraw about 4% of your portfolio in your first year of retirement, your portfolio has to be about 25 times your annual spending. The two rules describe the same relationship from opposite ends. One tells you how much to withdraw, the other how much to save.
Estimate your spending, not your income
The biggest input is spending, and most people anchor on salary instead. Retirement spending usually runs lower, because retirement contributions, payroll taxes, and commuting costs stop, and the mortgage may be gone. The common 70–80%-of-income shorthand is a placeholder built on averages, and averages sit far from any individual saver. Build the number from the bottom up instead. Add up what you expect to spend each month, annualize it, and give healthcare its own line, because it climbs faster than the rest of the budget as you age.
Subtract the income you don't have to save
The raw 25x rule assumes your portfolio funds every dollar you spend. Social Security, a pension, or an annuity pays part of your spending for you, and your portfolio only has to cover the gap.
Adjusted formula. Portfolio needed ≈ (annual spending − guaranteed annual income) × 25.
Run the same $60,000 spender through it, this time with $30,000 a year from Social Security.
| Approach | Calculation | Portfolio needed |
|---|---|---|
| Raw 25x rule | $60,000 × 25 | $1,500,000 |
| Spending minus Social Security | ($60,000 − $30,000) × 25 | $750,000 |
The benefit amount depends on your claiming age, so pull your own estimate from ssa.gov before plugging anything in. Either way, the arithmetic hands you two answers $750,000 apart. One formula treats Social Security as if it did not exist; the other treats it as covering half your spending from the day you retire. Neither is a plan, so we put both through the simulator.
What the simulation says
We built the $60,000 spender in the calculator as a single 65-year-old retiring now, with $2,500 a month of Social Security claimed at 67 and a plan that must last to age 95. The portfolio holds 60% traditional 401(k) and 15% Roth IRA at 7% growth, 20% taxable brokerage at 6.5%, and 5% cash at 4.5%. The engine withdraws in tax-aware order (taxable, then cash, then traditional, then Roth), grosses each withdrawal up for federal income tax, and inflates both spending and the benefit at 2.5%; our Monte Carlo explainer covers the mechanics. Only the starting balance changes between runs.
| Starting balance | How it was set | Success rate | Runs that deplete | Median depletion age |
|---|---|---|---|---|
| $1.5M | $60,000 × 25 | 97% | 3% | 93 |
| $1.2M | Trial | 91% | 9% | 92 |
| $1.0M | Trial | 78% | 22% | 91 |
| $750k | ($60,000 − $30,000) × 25 | 43% | 57% | 88 |
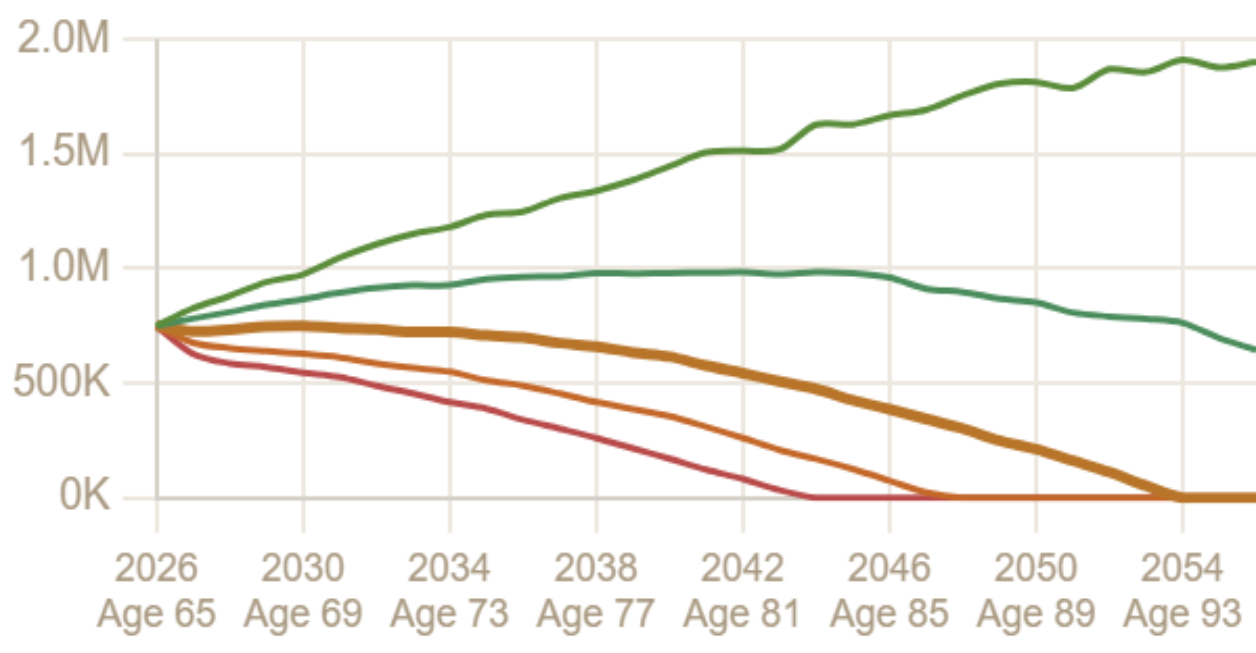
The raw 25x target passes easily, at a price. The median $1.5 million run ends at 95 holding about $3.1 million, so the typical outcome of saving to the headline number is dying with more than twice the starting balance. The SS-adjusted target fails more often than it succeeds, and its earliest failures arrive at age 76.
Why subtracting Social Security overshoots
The refinement fails for three reasons the multiplication cannot see. The benefit starts at 67, not 65, so the first two years draw the full $60,000 from the portfolio, exactly when a bad market does the most damage; sequence-of-returns risk is the mechanism. Withdrawals are taxed, so covering a $30,000 gap from a portfolio that is 60% traditional 401(k) takes more than $30,000 out. And returns arrive in random order with real volatility, which the engine models deliberately and which makes it read more conservative than the historical studies behind the 25x rule.
The number that actually holds
$1.2 million, about 20 times spending, clears a 91% success rate for the same retiree. The median run ends at 95 with about $1.87 million, and the failures that remain start no earlier than age 81.
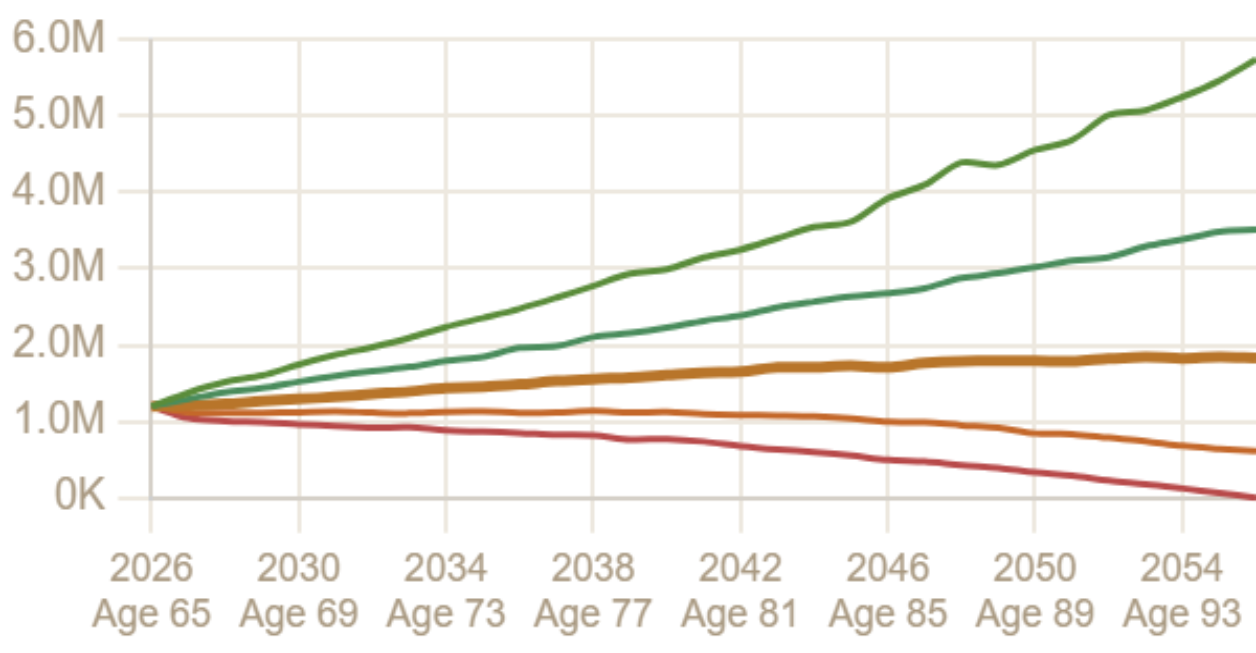
Two more facts fall out of the table. Money has diminishing returns; the step from $750,000 to $1 million buys 35 points of success, $1 million to $1.2 million buys 13, and the last $300,000 up to the headline target buys 6. Guaranteed income also beats savings dollar for dollar. Rerun the failing $750,000 plan as a married couple with a second, $15,000 spousal benefit and it succeeds 97% of the time. One extra check does the work of roughly $750,000 in the 401(k).
Retiring early moves the target
The 25x rule and every number above assume a retirement of about 30 years. Retire at 55 and the money must last 40, the safe withdrawal rate falls, and the multiple climbs toward 29–31x, before counting the extra years with no Social Security at all. Our guides to safe withdrawal rates and the 4% rule in early retirement quantify both effects.
Turning your number into a plan
The steps stack into a short process:
- Estimate your spending from the bottom up, in today's dollars.
- Subtract your guaranteed income, Social Security and any pension, to find the gap your portfolio has to cover.
- Multiply that gap by 25, or a bit more if you are retiring early, for a first target.
- Run the target through a Monte Carlo simulation with your real accounts, claim age, and horizon, and adjust the balance until the success rate clears your bar.
The first three steps produce a starting point. The fourth step produced the real answer above, and it moved the number by $300,000.
The bottom line
Your number is your spending, minus the income you have already secured, sized by a simulation rather than a multiplier. For the household above the answer was $1.2 million, 20% below the headline 25x figure and 60% above the subtract-Social-Security shortcut. Your spending, benefit, and account mix will move it. Enter them in the calculator, run 1,000 simulations, and you should land within a point or two of any number on this page. That takes about five minutes.
Sources
- William P. Bengen, "Determining Withdrawal Rates Using Historical Data," Journal of Financial Planning, 1994.
- Philip L. Cooley, Carl M. Hubbard, and Daniel T. Walz, "Retirement Savings: Choosing a Withdrawal Rate That Is Sustainable," AAII Journal, 1998 (the Trinity study).
Find your actual number.
Enter your spending, Social Security, and savings, then run a Monte Carlo simulation to see how much you really need for your timeline.
Open the Calculator →