The 4% rule was calibrated on a 30-year retirement, the kind that starts at 65. Retire at 45 and the same rule has to carry 50 years. Our safe withdrawal rate guide covers where the rule comes from and how our engine reads it. This article tests the early-retirement question directly. We entered one plan into our free calculator twice, once retiring at 65 and once retiring at 45, and changed nothing between the runs except the age fields.
One plan, entered twice
The saver has $1.2 million across four accounts and spends $4,000 a month in today's dollars, which is exactly 4% of the portfolio a year. The mix is deliberately brokerage-heavy, because an early retiree needs money outside retirement accounts and the engine spends taxable balances first. Social Security goes in on the Manual setting at $1,800 a month starting at 67, a reduced figure that reflects a short earnings record. The accounts go on the Assets tab and everything else goes on the Profile tab.
| Input | Value |
|---|---|
| 401(k) | $550,000, traditional, 7% expected growth |
| Brokerage | $500,000, taxable, 6.5% |
| Roth IRA | $100,000, 7% |
| Cash | $50,000, 4.5% |
| Retirement spending | $4,000 a month in today's dollars |
| Social Security | $1,800 a month, claiming at 67, entered manually |
| Lifespan setting | 95 |
| Simulations | 1000 |
The first run gives the saver a 1961 birth date and a retirement age of 65. The second gives the same saver a 1981 birth date and a retirement age of 45. Nothing else differs.
At 65, the rule scores 98%
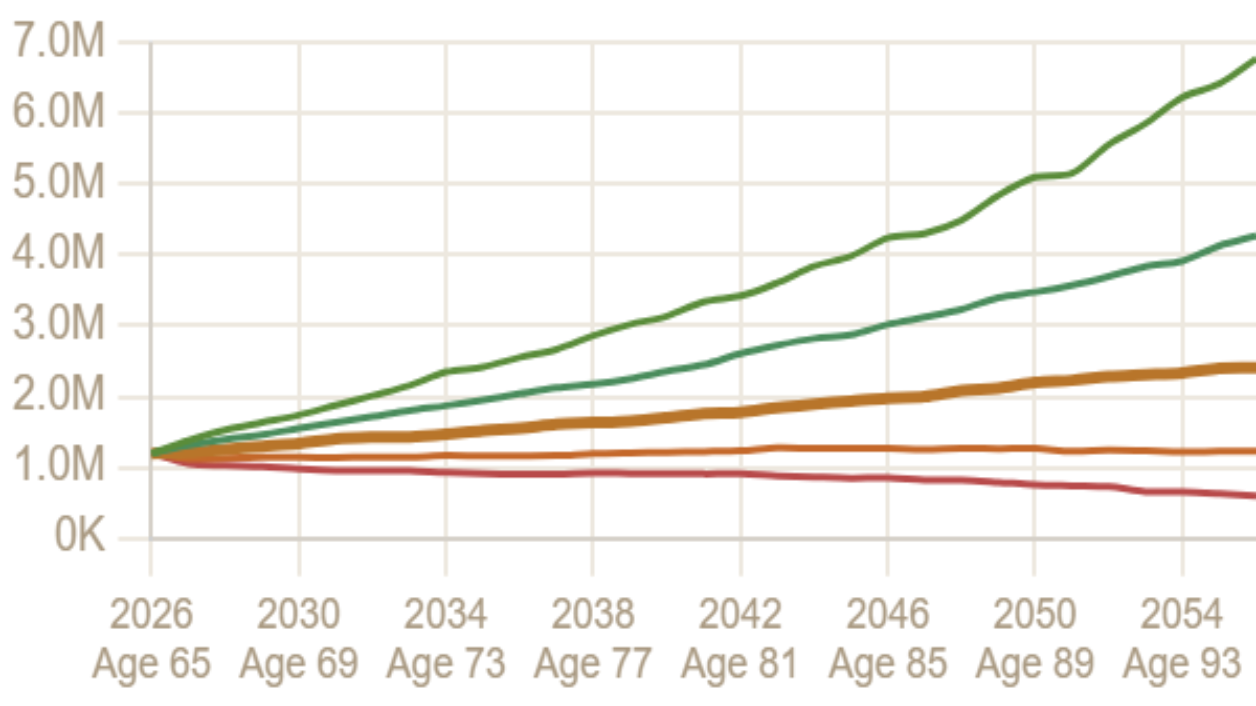
The 65-year-old's plan sustains spending through age 95 in 98% of 1,000 simulations. The portfolio only stands alone for two years before the $1,800 check arrives, and failures come late. In a 5,000-run batch through the same engine, the typical failing run went broke at 92 and the earliest at 84. The median run ends age 95 with about $2.3 million, and even the 10th percentile path ends with money left.
At 45, the identical inputs score 85%
Changing the birth year to 1981 and the retirement age to 45 drops the success rate to 85%. Roughly one run in seven now goes broke before 95. The typical failure hits at 86 instead of 92, and the earliest failure in a 5,000-run batch hit at 67. The mechanics are visible in the chart. The portfolio carries the full $4,000 alone for 22 of the 50 years, so a bad early stretch has two decades to compound before any help arrives. Our sequence-of-returns risk guide covers that mechanism on its own.
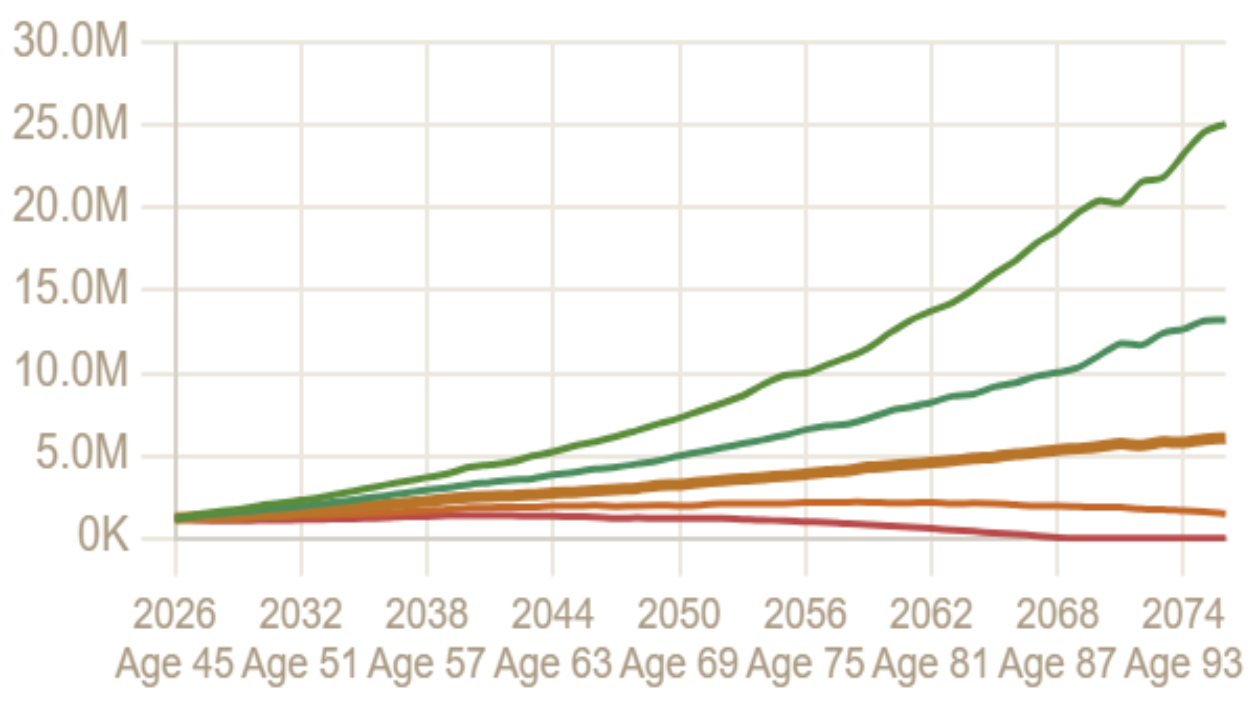
The long horizon widens both tails. The median run now ends with about $5.8 million and the 90th percentile clears $24 million, because 50 years of compounding rewards the runs that start well. The 10th percentile still hits zero before the finish. Social Security matters even from 22 years away. Deleting the $1,800 check entirely drops the same plan to 74%, so the reduced benefit is worth 11 points of success rate to a 45-year-old.
Walking the rate down at 45
We left the 45-year-old's plan alone and lowered only the monthly spending field. Figures come from 5,000-run batches through the same engine.
| Withdrawal rate | Monthly spending | Success rate | Runs that go broke | 10th percentile ending balance |
|---|---|---|---|---|
| 4.0% | $4,000 | 85% | 15% | $0 |
| 3.5% | $3,500 | 91% | 9% | $133,000 |
| 3.25% | $3,250 | 94% | 6% | $730,000 |
| 3.0% | $3,000 | 97% | 3% | $1,461,000 |
The exchange rate hiding in the table is that 3.0% at 45 buys about the same odds that 4% buys at 65, 97% against 98%, within run-to-run noise. Priced in dollars, retiring 20 years early costs $1,000 a month at the same level of safety. Read it the other way around and a 45-year-old who wants to keep spending $4,000 needs about $1.6 million, 33 times annual spending instead of the rule's 25. The last column is worth a look too. At 4% the worst tenth of runs ends at zero, and 3.5% is the first rate where the bottom decile keeps a six-figure cushion.
How these numbers compare to the backtests
Historical backtests like the Trinity study put the 4% rule in the mid-90s over 30 years. Our engine handles two things the classic studies do differently. It grosses every traditional withdrawal up for federal income tax and applies a volatility drag to each year's return draw, which pull the odds down; and both runs here include a Social Security check the classic studies exclude, which pushes them up. Compare the rows in this article with each other, not with the literature. On identical inputs, the calculator's 1,000-run mode lands within a couple of points of these figures. Our guide to a good Monte Carlo success rate covers what to make of an 85% once you have one.
The bottom line
One plan, run twice, prices the early-retirement question. The 4% rule earns 98% at 65 and 85% at 45, and the gap between those runs is nothing but the age fields. Failures also arrive earlier and cut deeper at 45, with the earliest broke run at 67 rather than 84. Dropping the rate to 3.0% wins the safety back at a cost of $1,000 a month. Every figure came from settings visible on screen. Run your own version in the calculator, free and with no account, and see what your rate scores at your age.
Sources
- William P. Bengen, "Determining Withdrawal Rates Using Historical Data," Journal of Financial Planning, 1994.
- Philip L. Cooley, Carl M. Hubbard, and Daniel T. Walz, "Retirement Savings: Choosing a Withdrawal Rate That Is Sustainable," AAII Journal, 1998 (the Trinity study).
- RetirFi simulation methodology, described on our about page. Every figure in this article comes from the same engine that runs the calculator.
See what the rule scores at your age.
Enter your accounts, set your retirement age, and run 1,000 simulations over your real horizon. Free, no account.
Open the Calculator →