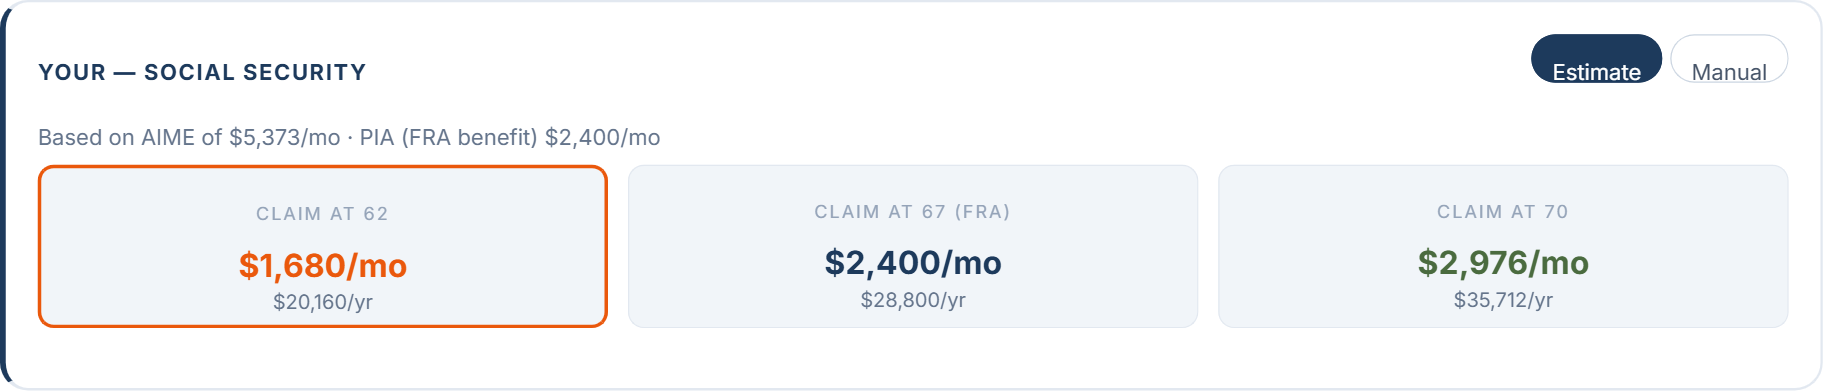
This article is a case study in using our Monte Carlo calculator to find the optimal age to claim Social Security. Claim at 62 and a $2,400 full-retirement-age benefit pays $1,680 a month for life. Wait until 70 and the same earnings record pays $2,976. The standard way to choose is break-even arithmetic, which compares cumulative checks and finds a crossover near age 80. The arithmetic ignores your savings, your spending, taxes, and market risk. We ran all three claim ages through 5,000 simulations on one retiree's plan, changing nothing except the claim age. Claiming at 62 sustained the plan to age 95 in 85% of simulations. Claiming at 67 raised the rate to 90%, and claiming at 70 raised it to 94%.
What each claim age pays
The Social Security Administration sets the schedule. Claiming at your full retirement age, 67 for anyone born in 1960 or later, pays 100% of your primary insurance amount, or PIA. Claiming at 62 cuts the check by 30%. Each year of delay past 67 adds an 8% credit, up to 124% of the PIA at 70, where the credits stop. Waiting past 70 gains nothing.
The calculator applies the schedule for you. Enter your income and years worked on the Profile tab and it estimates your PIA, then prices all three claim ages side by side. The retiree in this article has a $2,400 PIA.
The break-even arithmetic
Claiming early buys a head start that the bigger checks must repay. By 67, the 62-claimer has already banked $100,800. The 67-claimer then collects $720 a month more and erases the lead in about 140 months. The crossovers all land in a narrow band, because the SSA percentages are fixed regardless of your benefit size.
| Comparison | Early claimer's head start | Monthly difference | Break-even age |
|---|---|---|---|
| 62 vs. 67 | $100,800 | $720 | About 79 |
| 62 vs. 70 | $161,280 | $1,296 | About 80 |
| 67 vs. 70 | $86,400 | $576 | About 82 |
Live past the crossover and waiting pays more total dollars. Die before it and claiming early did. The formula is honest about what it measures, and what it measures is cumulative checks. Your portfolio pays every dollar of spending the check does not cover, and the formula never looks at it.
The same choice inside a full plan
We built the retiree in the calculator. Single, 62, retiring this year, planning to age 95. The savings total $750,000, split across a $500,000 traditional 401(k) growing at 7%, a $150,000 brokerage account at 6.5%, and $100,000 of cash at 4.5%. Spending is $3,500 a month in today's dollars. The engine inflates spending and the benefit at 2.5% a year, withdraws in tax-aware order (taxable, then cash, then traditional), and grosses every 401(k) withdrawal up for federal income tax. Between runs, exactly one input changes, the claim-age tile.
| Claim age | Monthly check | Success rate | Runs that run dry | Median depletion age |
|---|---|---|---|---|
| 62 | $1,680 | 85% | 15% | 91 |
| 67 | $2,400 | 90% | 10% | 91 |
| 70 | $2,976 | 94% | 6% | 91 |
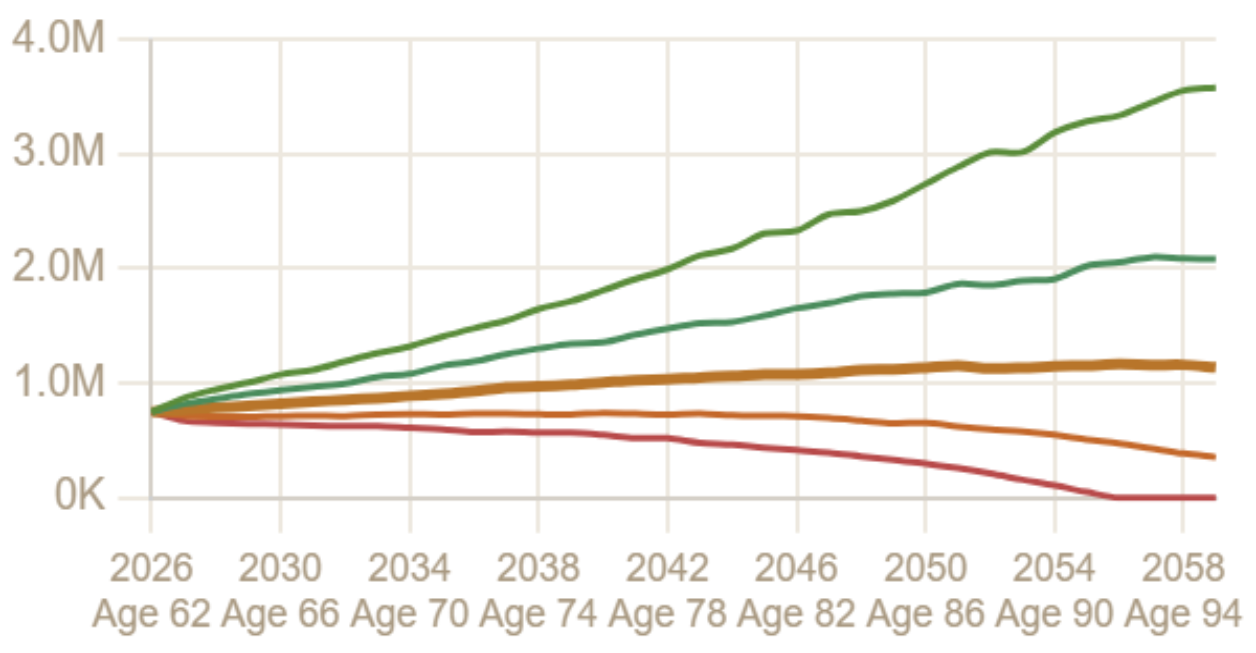
Delaying to 70 converts nine failing runs in every hundred into passing ones. The mechanism shows up in the shape of the charts. Claiming at 62 asks the portfolio for only $1,820 a month at the start, about 2.9% of the balance a year, and the median path climbs for a decade. Claiming at 70 makes the portfolio carry the full $3,500 for eight years, and the median path falls through the retiree's 60s until the $2,976 check stops the slide. From that point the plan leans on the portfolio so lightly that failures become rare.
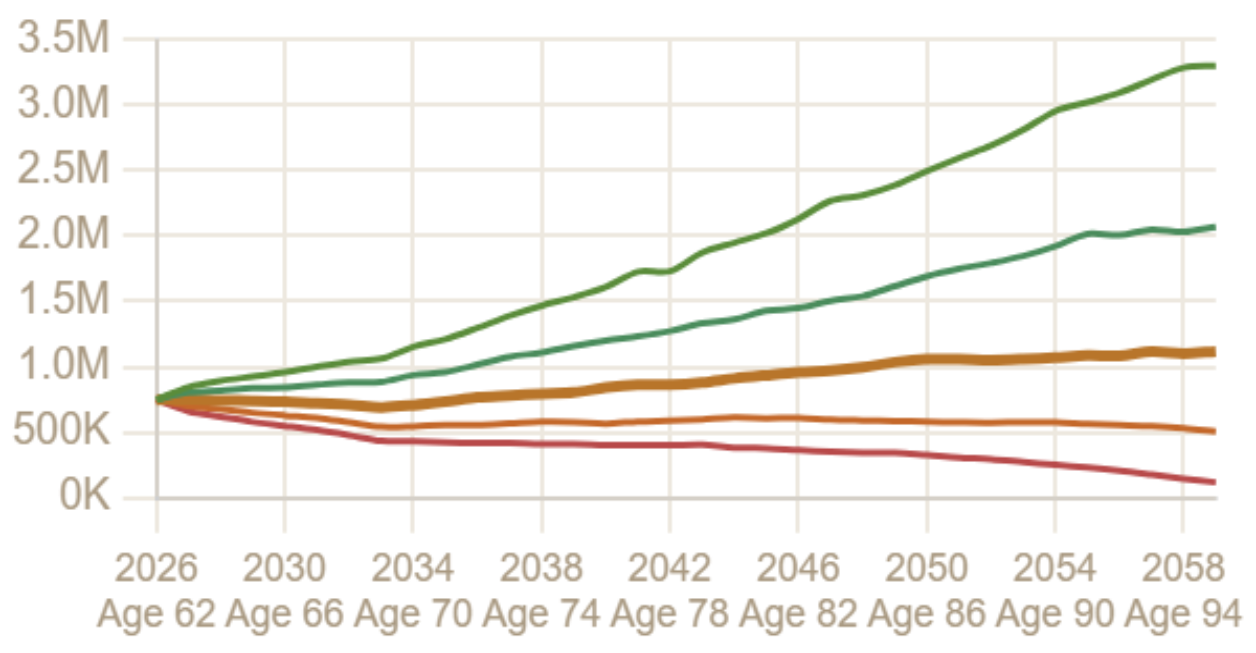
Two more facts fall out of the runs. Failures cluster in the same years either way. The median failing run dries up around age 91 under all three claim ages, and delaying mostly changes how many runs fail rather than when. And the upside moves in the opposite direction from the success rate. In the best tenth of markets the 62-claimer finishes age 95 with about $3.6 million against the 70-claimer's $3.37 million, because money not withdrawn in the early years compounds through the good decades. Delay works like insurance. It trims the best outcomes to protect the worst ones.
The bet is your horizon
Shorten the plan and the choice nearly stops mattering. The same household re-run to age 85 instead of 95 succeeds 98% of the time claiming at 62 and 99% claiming at 70, and the early claim leaves the larger median estate, $1.13 million against $1.01 million at 85. On a short horizon, claiming early costs one point of success and leaves about $125,000 more behind. On a long horizon it costs nine points. Claim age is a bet on your own longevity, and the simulation prices both sides of it. Change the plan-to age in the calculator and watch the spread move.
Run it on your own numbers
The whole comparison takes about five minutes in the calculator, free and with no login.
- On the Profile tab, enter your age, retirement age, income, and years worked. The Social Security card estimates your PIA and prices claiming at 62, 67, and 70. If you have your actual estimate from ssa.gov, switch the card to Manual and enter it directly. Any claim age from 62 to 70 is available in the profile fields.
- On the Assets tab, enter your account balances and growth rates.
- On the Monte Carlo tab, run 1,000 simulations, note the success rate, click a different claim-age tile, and run again. Rates are stochastic, so expect to land within a point or two of the numbers in this article on the same inputs.
One modeling note for exactness. The calculator treats benefits as today's dollars applied at the claim age, then indexes them for cost-of-living at 2.5% from that point forward. Two situations add rules of their own. If you claim before 67 while still working, the earnings test withholds $1 of benefit for every $2 earned above $24,480 in 2026, credited back at full retirement age. If you are married, the survivor keeps the larger of the two checks, which is the strongest reason for the higher earner to delay. Our guide to spousal benefits covers the mechanics, and the calculator models both spouses' claim ages and the survivor benefit directly.
The bottom line
Break-even arithmetic answers one question, which claim age pays the most cumulative dollars if you live to a given age. A simulation answers the question you actually have, which claim age gives your plan the best odds of lasting. For the $750,000 retiree above, the two answers agree in direction but not in kind. Waiting to 70 did not just win after age 80, it raised the odds of the whole plan surviving from 85% to 94%, at the price of smaller best-case balances and a leaner decade before the check starts. Whether that trade is worth it depends on your savings, spending, and horizon, and a success rate puts a number on it.
Sources
Price your own claim ages.
Enter your benefit, savings, and timeline, then run 1,000 Monte Carlo simulations at 62, 67, and 70. One click switches the claim age.
Open the Calculator →